Coolest Thing I’ve Learned in R
So I think the coolest thing I’ve learned in R is honestly extremely simple.
The nature in which the language is interpreted is so simple it blows my mind. Particularly when I am rebuilding/morphing/manipulating data sets its just easy.
For example, when we were doing our caretPackage and model training homework, I wanted to remove the date column from my dataset. I’m sure there’s a lot of ways to pop off one column, but the below lines blew me away:
seoulBike <- seoulBike[ ,!(names(seoulBike) %in% c("Date"))]
Any column with the name Date in it? Gone! All in the same line as the one I set the object again. I come from an SQL background and the ability to manipulate objects is a bit more crude so this is just very nice for me. I’m sure dev’s from other languages don’t think this is a big deal but it really just makes me appreciate how eloquently some coding languages R.
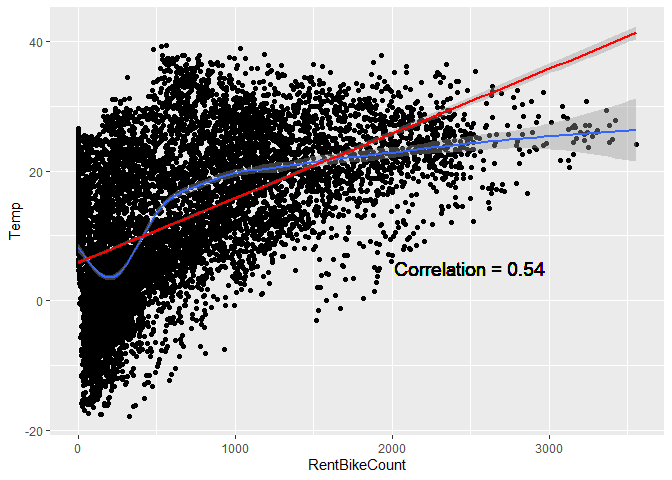
Just to ensure that you don’t think I picked this because it was easy, I have gone ahead and attempted a plot below.
seoulBike <- read_csv(file = "../_Rmd/_datasets/SeoulBikeData.csv", locale=locale(encoding="latin1"))
## Rows: 8760 Columns: 14
## ── Column specification ──────────────────────────────────────────────────────────────────────────────────────
## Delimiter: ","
## chr  (4): Date, Seasons, Holiday, Functioning Day
## dbl (10): Rented Bike Count, Hour, Temperature(°C), Humidity(%), Wind speed (m/s), Visibility (10m), Dew p...
##
## ℹ Use `spec()` to retrieve the full column specification for this data.
## ℹ Specify the column types or set `show_col_types = FALSE` to quiet this message.
seoulBike <- seoulBike[ ,!(names(seoulBike) %in% c("Date"))]

names(seoulBike) <- c('RentBikeCount','Hour','Temp','Humid','WindSpeed','Visi','DewPointTemp','SolarRad','Rainfall','Snowfall','Seasons','Holiday','WorkDay','HighRentDay')
## Warning: The `value` argument of `names<-` must have the same length as `x` as of tibble 3.0.0.
## `names` must have length 13, not 14.
names(seoulBike)
##  [1] "RentBikeCount" "Hour"          "Temp"          "Humid"         "WindSpeed"     "Visi"
##  [7] "DewPointTemp"  "SolarRad"      "Rainfall"      "Snowfall"      "Seasons"       "Holiday"
## [13] "WorkDay"
correlation <- cor(seoulBike$RentBikeCount, seoulBike$Temp)

g <- ggplot(data = seoulBike, aes(x = RentBikeCount, y = Temp))
g + geom_point() + geom_smooth() + geom_smooth(method = glm, col = "Red") +
  geom_text(x=2500, y = 5, size = 5, label = paste0("Correlation = ", round(correlation, 2)))
## `geom_smooth()` using method = 'gam' and formula 'y ~ s(x, bs = "cs")'
## `geom_smooth()` using formula 'y ~ x'
rmarkdown::render(“_Rmd/2022-06-30-CoolThing.Rmd”,output_format = md_document(“markdown_github”),output_dir = “_posts”, output_options = list(keep_html=FALSE))